The States With The Five Highest & Lowest Enlistment Rates
There are so many different ways to show love for one’s country, and many of those are not very obvious or even public. It could be volunteering, passing on traditions and pastimes, or flying an American flag at home. Maybe it is just a quiet appreciation for the United States of America. For the WalletHub Statistics Center, one prominent way to tangibly measure patriotism was by looking at the number of citizens enlisting in the military. What says “I love America” more than signing your life and career to it, taking an oath to fight and die for it if necessary?
That’s one of the factors WalletHub took into account for a recently published study. The statisticians looked at data from 2010 to 2015 and compared the average number of military enlistees per 1,000 civilian adults in each of the 50 states. The study says it only looked at enlisted personnel, not officers, when comparing states. What they came up with is the five states with the highest enlistment average and the states with the lowest enlistment average.
Many factors must be taken into account when looking at states’ military enlistment rates, such as population demographics, local economic factors, and much more. The numbers don’t give any indication as to why some states have higher or lower enlistment rates; the study just presents the numbers straightforward as they are.
Take a look at the list below, which starts with the states which have the lowest average military enlistment rates. Then click “next” at the bottom of the page to see the five states with the highest enlistment rates. Do you live in one of these states?
Lowest Enlistment Rates
5. Vermont

Vermont, located near the top of New England, is the second least populated state. It also has the fifth lowest enlistment rate per capita, with 0.429 military enlistees per 1,000 adult civilians.
4. New Jersey

Shortly down the New England coast, New Jersey is the most densely populated state, despite being the fourth smallest. It comes in with the fourth lowest enlistment rate, with 0.426 military enlistees per 1,000 adult civilians.
3. Rhode Island
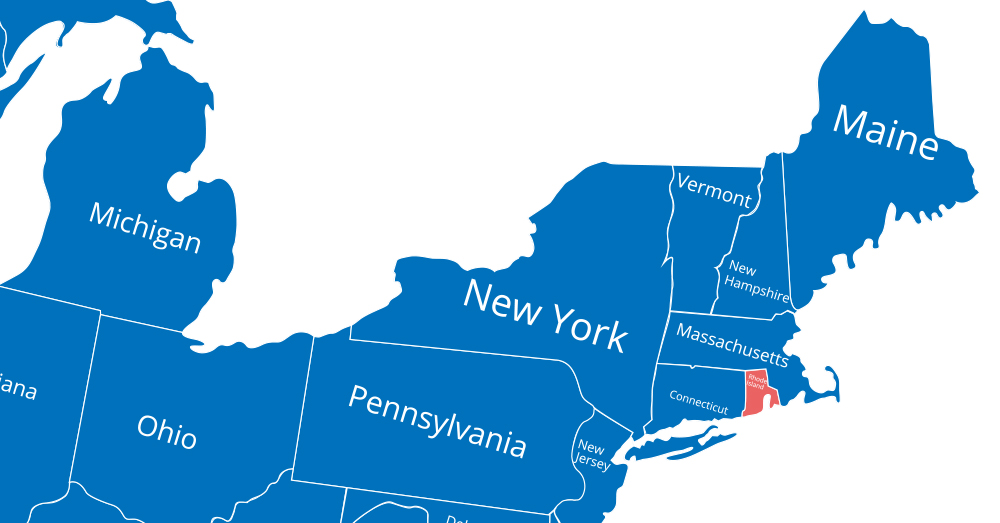
Staying in the New England area, Rhode Island ranks 48th out of 50 states for military enlistment from 2010 to 2015. Rhode Islanders averaged 0.408 military enlistees per 1,000 adult civilians.
2. Massachusetts

“By the sword we seek peace, but peace only under liberty” is the motto of Massachusetts, but the New England state has the second lowest enlistment rate in the country. From 2010 to 2015, Massachusetts had an average of 0.407 military enlistees per 1,000 adult civilians.
1. North Dakota
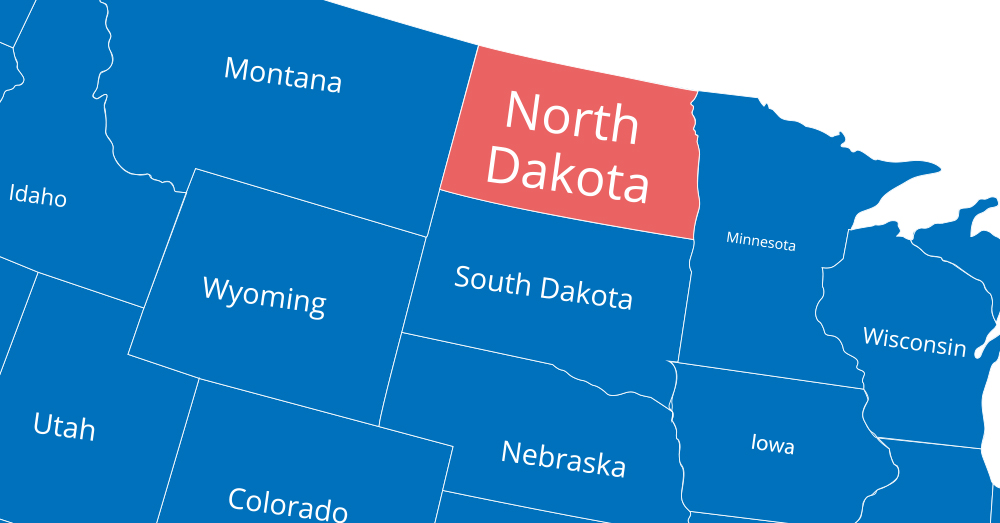
North Dakota ranks 50th out of 50 states with the lowest enlistment rate in the country. Located at the top center of the nation, North Dakota is the fourth least populated state as well.
Keep reading to find out which states have the highest enlistment rates!
Highest Enlistment Rates
5. Texas
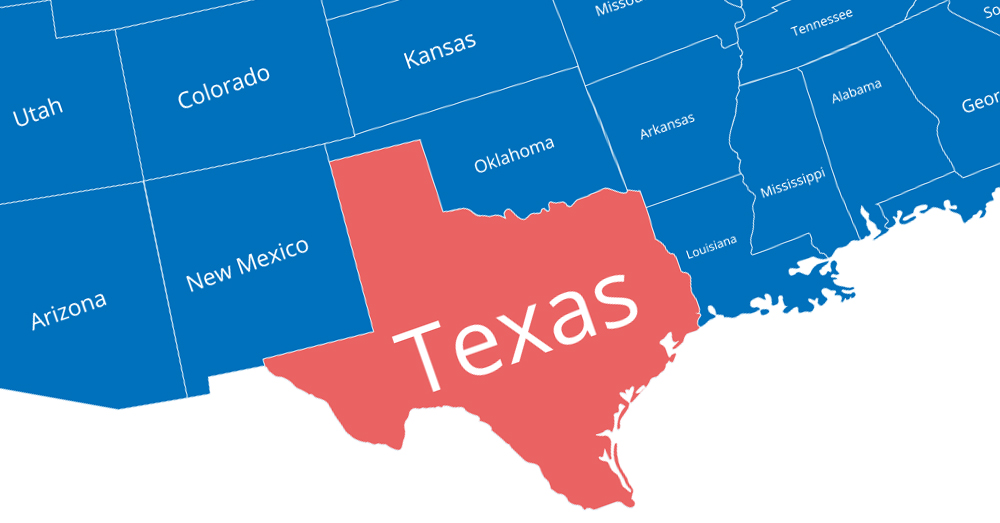
Home of the Alamo, Texas is steeped in state pride. “Don’t mess with Texas” is a common phrase now for the state that prides itself for toughness, among other things. The Lone Star State ranks 5th out of 50 states for enlistments, with 0.819 military enlistees per 1,000 adult civilians.
4. Alaska
The largest and most sparsely populated state, Alaska, comes in at number four for enlistment rates in America. With multiple military bases and installations throughout the state, Alaska has an average of 0.829 military enlistees per 1,000 adult civilians.
3. Idaho
Idaho, the Gem State (or the potato state to some!), is third in the nation for military enlistments. While Idaho has nearly 40 percent of its land held by the United States Forest Service, as well as the Rocky Mountains to deal with, it has an average of 0.832 military enlistees per 1,000 civilian adults.
2. South Carolina
On the other side of the country, South Carolina has the second highest enlistment rate in the country. From 2010 to 2015, South Carolina had an average of 0.847 military enlistees per 1,000 adult civilians.
1. Georgia

South Carolina’s neighbor to the south, the Peach State ranks first in the country for military enlistment rates. Georgia has an average of 0.921 military enlistees per 1,000 adult civilians.
Now take a look at where all 50 states are ranked according to military enlistments!
Here are all 50 states ranked from highest to lowest enlistment rate from the 2017 study by WalletHub, provided by Diana Popa, Communications Manager at WalletHub.
Where does your state rank on the list?
1. Georgia — 0.921 average military enlistees per 1,000 adult civilians
2. South Carolina — 0.847 average military enlistees per 1,000 adult civilians
3. Idaho — 0.832 average military enlistees per 1,000 adult civilians
4. Alaska — 0.829 average military enlistees per 1,000 adult civilians
5. Texas — 0.819 average military enlistees per 1,000 adult civilians
6. Arizona — 0.788 average military enlistees per 1,000 adult civilians
7. Virginia — 0.786 average military enlistees per 1,000 adult civilians
8. Alabama — 0.781 average military enlistees per 1,000 adult civilians
9. North Carolina — 0.770 average military enlistees per 1,000 adult civilians
10. Florida — 0.770 average military enlistees per 1,000 adult civilians
11. Oklahoma — 0.752 average military enlistees per 1,000 adult civilians
12. Hawaii — 0.740 average military enlistees per 1,000 adult civilians
13. Wyoming — 0.716 average military enlistees per 1,000 adult civilians
14. Colorado — 0.714 average military enlistees per 1,000 adult civilians
15. Nevada — 0.708 average military enlistees per 1,000 adult civilians

16. Tennessee — 0.696 average military enlistees per 1,000 adult civilians
17. Missouri — 0.690 average military enlistees per 1,000 adult civilians
18. Washington — 0.677 average military enlistees per 1,000 adult civilians
19. Montana — 0.672 average military enlistees per 1,000 adult civilians
20. Mississippi — 0.668 average military enlistees per 1,000 adult civilians
21. Oregon — 0.659 average military enlistees per 1,000 adult civilians
22. Arkansas — 0.654 average military enlistees per 1,000 adult civilians
23. Maine — 0.650 average military enlistees per 1,000 adult civilians
24. New Mexico — 0.648 average military enlistees per 1,000 adult civilians
25. Ohio — 0.643 average military enlistees per 1,000 adult civilians
26. Indiana — 0.636 average military enlistees per 1,000 adult civilians
27. Nebraska — 0.636 average military enlistees per 1,000 adult civilians
28. Kansas — 0.633 average military enlistees per 1,000 adult civilians
29. New Hampshire — 0.620 average military enlistees per 1,000 adult civilians
30. California — 0.611 average military enlistees per 1,000 adult civilians

31. Maryland — 0.599 average military enlistees per 1,000 adult civilians
32. South Dakota — 0.587 average military enlistees per 1,000 adult civilians
33. Louisiana — 0.575 average military enlistees per 1,000 adult civilians
34. Michigan — 0.566 average military enlistees per 1,000 adult civilians
35. Utah — 0.550 average military enlistees per 1,000 adult civilians
36. Illinois — 0.546 average military enlistees per 1,000 adult civilians
37. Delaware — 0.546 average military enlistees per 1,000 adult civilians
38. Wisconsin — 0.537 average military enlistees per 1,000 adult civilians
39. Kentucky — 0.535 average military enlistees per 1,000 adult civilians
40. West Virginia — 0.519 average military enlistees per 1,000 adult civilians
41. Iowa — 0.518 average military enlistees per 1,000 adult civilians
42. Pennsylvania — 0.493 average military enlistees per 1,000 adult civilians
43. Connecticut — 0.439 average military enlistees per 1,000 adult civilians
44. Minnesota — 0.438 average military enlistees per 1,000 adult civilians
45. New York — 0.436 average military enlistees per 1,000 adult civilians
46. Vermont — 0.429 average military enlistees per 1,000 adult civilians
47. New Jersey — 0.426 average military enlistees per 1,000 adult civilians
48. Rhode Island — 0.408 average military enlistees per 1,000 adult civilians
49. Massachusetts — 0.407 average military enlistees per 1,000 adult civilians
50. North Dakota — 0.358 average military enlistees per 1,000 adult civilians